
Divorce rate by state
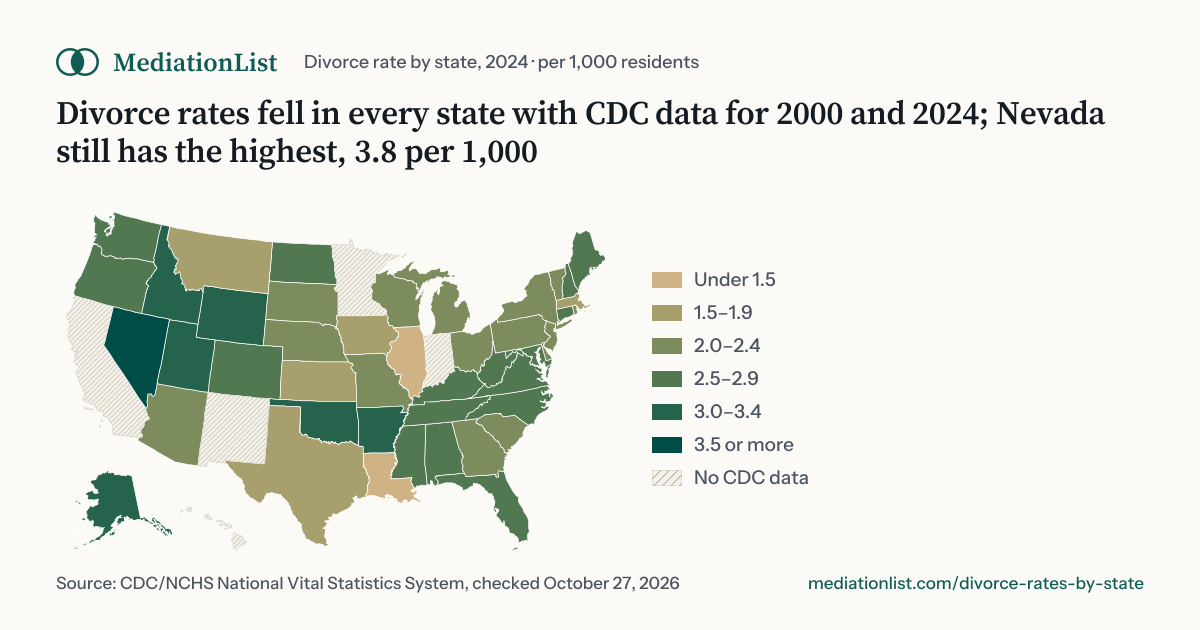
How many divorces each state grants per 1,000 residents, from the CDC’s National Vital Statistics System, with the change since 2000 and the Census Bureau’s survey estimate for every state, including the 5 with no CDC figure.[1][3]
What state has the highest divorce rate?
Nevada had the highest divorce rate in 2024 among the 45 states and DC that report to the CDC, 3.8 divorces per 1,000 residents; Louisiana had the lowest, 0.8.[1] The U.S. rate for reporting states was 2.3 in 2024, against 4.0 in 2000.[2] California, Hawaii, Indiana, Minnesota and New Mexico have no CDC rate; the Census survey measure below covers every state.[3]
Key facts
| Highest, 2024 | Nevada · 3.8 per 1,000[1] |
|---|---|
| Lowest, 2024 | Louisiana · 0.8 per 1,000[1] |
| U.S. rate, 2024 | 2.3 per 1,000 (2000: 4.0)[2] |
| Lower than in 2000 | 44 of 44 states with both years[1] |
| Data checked | October 27, 2026 |
Nevada had the highest divorce rate in 2024, 3.8 per 1,000 residents, ahead of Arkansas and Oklahoma (3.3); Louisiana reported the lowest, 0.8
Divorces and annulments granted in each state per 1,000 residents, from the CDC’s National Vital Statistics System. The reported U.S. rate was 2.3 in 2024, down from 4.0 in 2000. The CDC table has no 2024 figure for California, Hawaii, Indiana, Minnesota and New Mexico.
- Under 1.5
- 1.5–1.9
- 2.0–2.4
- 2.5–2.9
- 3.0–3.4
- 3.5 or more
- No CDC data
Divorces per 1,000 residents
Tap a state to see its rate; tap again to open its page.
States in each band, of 51 (50 states + DC): Under 1.5: 2 · 1.5–1.9: 5 · 2.0–2.4: 16 · 2.5–2.9: 16 · 3.0–3.4: 6 · 3.5 or more: 1 · no CDC data: 5.
Source: CDC/NCHS, National Vital Statistics System, “Divorce rates by State: 1990, 1995, and 2000-2024” (provisional counts by state of occurrence; per 1,000 total population; includes annulments and, for some counties or states, petitions filed or legal separations). Checked October 27, 2026.
Data as of (version 2026.10.28)What changedCDC and Census figures as published on that date.
Data as of = when the sources were read · Version = the data release · Page updated = the last change to this page
Every state with data for both years is lower than in 2000
Divorces per 1,000 residents, 2000 (open dot) and 2024 (solid dot), the 43 states and DC with a CDC rate for both years. Nevada fell furthest, −62%. Louisiana and Oklahoma had no 2000 rate.[1]
- Nevada3.8−62%
- Arkansas3.3−48%
- Wyoming3.2−45%
- Idaho3.2−42%
- Alaska3.1−21%
- Utah3.0−30%
- Alabama2.9−47%
- Kentucky2.9−43%
- Colorado2.9−38%
- Florida2.8−45%
- West Virginia2.8−45%
- Oregon2.8−42%
- Maryland2.8−15%
- Tennessee2.7−54%
- Mississippi2.7−46%
- Virginia2.6−40%
- North Dakota2.6−24%
- Maine2.5−50%
- New Hampshire2.5−48%
- Washington2.5−46%
- North Carolina2.5−44%
- Connecticut2.5−24%
- Missouri2.4−47%
- Delaware2.4−38%
- Nebraska2.4−35%
- Ohio2.3−45%
- Vermont2.3−44%
- South Dakota2.3−34%
- New Jersey2.3−23%
- New York2.3−23%
- Rhode Island2.3−21%
- Michigan2.2−44%
- South Carolina2.2−42%
- Georgia2.2−33%
- Arizona2.1−54%
- District of Columbia2.1−34%
- Pennsylvania2.1−32%
- Wisconsin2.0−38%
- Montana1.9−55%
- Texas1.9−52%
- Iowa1.8−45%
- Kansas1.7−53%
- Massachusetts1.5−40%
- Illinois1.3−59%
Source: CDC/NCHS, National Vital Statistics System, “Divorce rates by State: 1990, 1995, and 2000-2024”. Change is the percentage change between the two published rates. Checked October 27, 2026.
The reported U.S. rate has fallen by 43% since 2000
Divorces and annulments per 1,000 people, 2000–2024, CDC national series. The national rate covers only reporting states, and the list of states left out changes over the years (the table below has each state’s own series).[2]
Source: CDC/NCHS, National Vital Statistics System, “Provisional number of divorces and annulments and rate: United States, 2000–2024”. 2024: excludes California, Hawaii, Indiana, Minnesota and New Mexico.
Divorce rates by state, 2000–2024
CDC: divorces per 1,000 residents (“—” = no data in the CDC table). Census: women who divorced in the past year per 1,000 women 15+, with the 90% margin of error. Two different measures; compare down a column, not across.[1][3]
| State | CDC 2000[1] | CDC 2010 | CDC 2024 | Change since 2000 | Census 2024 (women)[3] |
|---|---|---|---|---|---|
| Alabama | 5.5 | 4.4 | 2.9 | −47% | 8.7 ±1.1 |
| Alaska | 3.9 | 4.7 | 3.1 | −21% | 9.3 ±3.6 |
| Arizona | 4.6 | 3.5 | 2.1 | −54% | 7.0 ±1.1 |
| Arkansas | 6.4 | 5.7 | 3.3 | −48% | 9.2 ±1.7 |
| California | — | — | —* | — | 6.2 ±0.4 |
| Colorado | 4.7 | 4.3 | 2.9 | −38% | 7.8 ±1.3 |
| Connecticut | 3.3 | 2.9 | 2.5 | −24% | 6.7 ±1.2 |
| Delaware | 3.9 | 3.5 | 2.4 | −38% | 7.5 ±3.1 |
| District of Columbia | 3.2 | 2.8 | 2.1 | −34% | 5.1 ±2.5 |
| Florida | 5.1 | 4.4 | 2.8 | −45% | 7.3 ±0.6 |
| Georgia | 3.3 | — | 2.2 | −33% | 7.3 ±0.9 |
| Hawaii | 3.9 | — | —* | — | 6.4 ±2.1 |
| Idaho | 5.5 | 5.2 | 3.2 | −42% | 6.1 ±1.4 |
| Illinois | 3.2 | 2.6 | 1.3 | −59% | 6.1 ±0.7 |
| Indiana | — | — | —* | — | 7.6 ±0.9 |
| Iowa | 3.3 | 2.4 | 1.8 | −45% | 7.3 ±1.1 |
| Kansas | 3.6 | 3.7 | 1.7 | −53% | 6.4 ±1.2 |
| Kentucky | 5.1 | 4.5 | 2.9 | −43% | 8.4 ±1.3 |
| Louisiana | — | — | 0.8 | — | 7.6 ±1.2 |
| Maine | 5.0 | 4.2 | 2.5 | −50% | 5.1 ±1.3 |
| Maryland | 3.3 | 2.8 | 2.8 | −15% | 6.4 ±1.0 |
| Massachusetts | 2.5 | 2.5 | 1.5 | −40% | 6.4 ±1.0 |
| Michigan | 3.9 | 3.5 | 2.2 | −44% | 5.8 ±0.6 |
| Minnesota | 3.2 | — | —* | — | 6.2 ±0.8 |
| Mississippi | 5.0 | 4.3 | 2.7 | −46% | 8.9 ±2.0 |
| Missouri | 4.5 | 3.9 | 2.4 | −47% | 6.8 ±1.0 |
| Montana | 4.2 | 3.9 | 1.9 | −55% | 6.2 ±2.1 |
| Nebraska | 3.7 | 3.6 | 2.4 | −35% | 8.6 ±1.8 |
| Nevada | 9.9 | 5.9 | 3.8 | −62% | 9.3 ±1.9 |
| New Hampshire | 4.8 | 3.8 | 2.5 | −48% | 7.9 ±2.3 |
| New Jersey | 3.0 | 3.0 | 2.3 | −23% | 5.5 ±0.6 |
| New Mexico | 5.1 | 4.0 | —* | — | 5.8 ±1.7 |
| New York | 3.0 | 2.9 | 2.3 | −23% | 5.5 ±0.5 |
| North Carolina | 4.5 | 3.8 | 2.5 | −44% | 6.2 ±0.7 |
| North Dakota | 3.4 | 3.1 | 2.6 | −24% | 7.5 ±2.6 |
| Ohio | 4.2 | 3.4 | 2.3 | −45% | 6.8 ±0.6 |
| Oklahoma | — | 5.2 | 3.3 | — | 10.5 ±1.3 |
| Oregon | 4.8 | 4.0 | 2.8 | −42% | 8.5 ±1.2 |
| Pennsylvania | 3.1 | 2.7 | 2.1 | −32% | 6.2 ±0.6 |
| Rhode Island | 2.9 | 3.2 | 2.3 | −21% | 7.4 ±2.2 |
| South Carolina | 3.8 | 3.1 | 2.2 | −42% | 5.9 ±1.0 |
| South Dakota | 3.5 | 3.4 | 2.3 | −34% | 8.7 ±3.0 |
| Tennessee | 5.9 | 4.2 | 2.7 | −54% | 8.1 ±1.0 |
| Texas | 4.0 | 3.3 | 1.9 | −52% | 7.8 ±0.6 |
| Utah | 4.3 | 3.7 | 3.0 | −30% | 7.6 ±1.4 |
| Vermont | 4.1 | 3.8 | 2.3 | −44% | 7.5 ±2.7 |
| Virginia | 4.3 | 3.8 | 2.6 | −40% | 6.6 ±0.7 |
| Washington | 4.6 | 4.2 | 2.5 | −46% | 8.3 ±1.0 |
| West Virginia | 5.1 | 5.1 | 2.8 | −45% | 8.0 ±2.0 |
| Wisconsin | 3.2 | 3.0 | 2.0 | −38% | 5.4 ±0.9 |
| Wyoming | 5.8 | 5.1 | 3.2 | −45% | 10.7 ±3.2 |
| United States | 4.0 | 3.6 | 2.3 | −43% | 6.9 ±0.2 |
* No CDC figure for 2024; last published rate: California 4.3 (1990), Hawaii 3.7 (2002), Indiana none in the table, Minnesota 2.8 (2004), New Mexico 3.3 (2015). CDC U.S. rates cover reporting states only (2024 leaves out California, Hawaii, Indiana, Minnesota and New Mexico). Census margins of error are 90% confidence intervals computed from the published estimates with the Census Bureau’s formula for a proportion. The full CDC series (1990, 1995, 2000–2024) is in the download.[1][2][3]
Questions about divorce rates
Which state has the highest divorce rate?
Nevada, at 3.8 divorces per 1,000 residents in 2024, followed by Arkansas (3.3) and Oklahoma (3.3), in the CDC’s state table. The lowest reported rate is Louisiana’s, 0.8. California, Hawaii, Indiana, Minnesota and New Mexico have no 2024 rate in the CDC table, so they aren’t ranked.[1][3]
What is the divorce rate in the U.S.?
2.3 divorces and annulments per 1,000 people in 2024 (662,950 divorces), according to the CDC’s National Vital Statistics System. That rate covers only the states that report; it leaves out California, Hawaii, Indiana, Minnesota and New Mexico.[1][3]
Is the divorce rate going down?
Yes, among the states that report. The CDC’s U.S. rate fell from 4.0 per 1,000 in 2000 to 2.3 in 2024, and every one of the 43 states and DC with a CDC rate for both years is lower now. The CDC rate counts divorces per resident, so it is not the share of marriages that end in divorce.[1][3]
Which states have no CDC divorce rate?
California, Hawaii, Indiana, Minnesota and New Mexico have no CDC rate for 2024. For those states the Census Bureau’s American Community Survey gives a different measure: women who say they divorced in the past year, per 1,000 women 15 and older (California 6.2, Hawaii 6.4, Indiana 7.6, Minnesota 6.2, New Mexico 5.8; U.S. 6.9).[1][3]
Why do the CDC and Census numbers differ?
They count different things. The CDC counts divorce decrees in the state that granted them, per 1,000 residents of all ages. The Census survey counts women 15 and older who say they divorced in the last 12 months, by where they live now, per 1,000 women 15 and older, and each estimate has a margin of error. Compare states within one measure, never across the two.[1][3]
Which states are no-fault divorce states?
All 41 states whose divorce law we’ve verified allow a divorce without proving fault; 13 allow only no-fault grounds. See the no-fault divorce states map, with each state’s statute or official court guidance cited.
Use this map and data
Free to reuse under CC BY 4.0. Required attribution: MediationList.com, from CDC/NCHS and Census Bureau data
, with a link to this page.
Sources
All figures checked October 27, 2026.
- CDC/NCHS, National Vital Statistics System: “Divorce rates by State: 1990, 1995, and 2000-2024” (PDF)↩
- CDC/NCHS: “Provisional number of divorces and annulments and rate: United States, 2000–2024” (PDF)↩
- U.S. Census Bureau, American Community Survey 2024 1-year estimates, table B12503↩
- U.S. Census Bureau, American Community Survey 2024 summary file↩
- CDC/NCHS, Marriage and divorce (FastStats page that links the tables)
Method
The CDC table’s own notes: “Rates are based on provisional counts of divorces by state of occurrence. Rates are per 1,000 total population residing in area.” “Includes annulments. Includes divorce petitions filed or legal separations for some counties or States.”[1] The national series gives the U.S. rate and the states it leaves out each year.[2] The Census rate is women 15+ divorced in the last year ÷ women 15+ × 1,000, from table B12503, “Divorces in the Last Year by Sex by Marital Status for the Population 15 Years and Over,” read from the summary file.[3][4]
We read the CDC table twice (by column position and in reading order) and the build stops if the two readings disagree; the national rate is also recomputed from its published count and population. Where states’ divorce laws are mentioned, see divorce laws by state; that page quotes each statute. Not legal advice.
Cite this page
MediationList. (2026). Divorce rates by state (Version 2026.10.28) [Data set]. Retrieved October 29, 2026, from https://mediationlist.com/divorce-rates-by-state/
APA 7th ed. A retrieval date is included only for pages whose content changes, such as maps, data and tools.